Sustainable Competitive Advantage is any business advantage which a firm can keep holding for long time, usually around 3-5 years. In the travel industry, however, the idea has transformed dramatically. For travel’s traditional sources of advantage like unique relationships with suppliers, premium service sets, and innovative technology implementations the period of time over which such advantage can be sustained is fast declining.
B2B Travel Process automation is a game changing driver to develop competitive advantage and long-term success in B2B travel. Unlike traditional models that can simply be replicated or bought, when it comes to automation, as data accrues, as network effects become stronger, as integration grows more complicated compounded gains result. Almost all (98%) of executives have started automation projects, but just 13% execute a broad strategy that allows them to maintain their competitive advantage. (Source: McKinsey Global Institute)
This article looks at inherent features that lend itself to sustainable travel businesses and process automation from industry data and real life relevance.
A sustainable competitive advantage needs to satisfy the three conditions set by the strategic management theory:
Due to the reduced replication cycles and standardization of markets the sustainability test is failed by the majority of the traditional competitive strategies in B2B travel.
Partnerships that previously took years to attain due to their complex nature are now replicable via streamlined distribution channels. NDC’s adoption by more than 60% of airlines has automated access to an inventory dependent on prior relationships. Major carriers, such as, Lufthansa, Emirates and American Airlines have started providing exclusive content via technology marketplaces instead of through bilateral negotiations.
The emergence of Cloud infrastructure and SaaS solutions has dismantled IT barriers, which offered strongholds to traditional competitors. Booking, expense management, and customer service platforms can be now procured on subscription basis which avail enterprise grade resources to players of every tier, thus diminishing technological advantage to sophistry of implementation.
Sources suggest 78% of business travelers prefer self-service technology for trip management. The change means meeting viewable service features is no longer an option and businesses must incur expense in order to create the illusion of difference.
| Traditional Advantage | Replication Time | Sustainability | Why It Fails |
|---|---|---|---|
| Exclusive Supplier Partnerships | 6–18 months | Low | NDC platforms democratize access; relationships can be outbid |
| Premium Service Features | 3–12 months | Very Low | Features become baseline expectations; easily copied |
| Advanced Technology Tools | 1–6 months | Low | SaaS platforms make enterprise tools accessible to all |
| Brand Recognition | 2–5 years | Medium | Requires continuous investment; vulnerable to reputation damage |
| Cost Leadership | 6–24 months | Medium | Can be replicated through operational improvements or scale |
| Process Automation | 3–5 years | Very High | Data accumulation, network effects, and integration complexity create compound advantages |
Process automation differs fundamentally from other competitive strategies through four mechanisms that create compound advantages over time.
Each automated transaction generates specific data that allows the system to perform better in its future operations. The point is the intelligence acquired through the data from prior interactions would be almost impossible to replicate for new competitors who would have to start from scratch. It is impossible to quickly purchase such data or replicate a large system that has worked with real clients for years from scratch
Example of implementation: the automated booking system of travel management company after 18-24 months of transaction learns that Client A employees usually book $20 below the recommended limit hotels in some specific cities, they often take night flights if they are flying within the same country while when being abroad, they generally choose flights up until 15.00 local time, and require 48 hours’ notice before the flight to change their itinerary. The example shows that collection of data from multiple interactions is impossible to purchase all at once for new market entrants.
The way the mechanism can be sustained: This mechanism can be sustained through time because the data collection process is long. An automated transaction system’s competitor who decides to start advancing automation at the present moment will not have historical patterns of interaction to make system processing decisions smarter.
Automation platforms become more valuable as they scale, creating positive feedback loops that benefit all participants while raising barriers for competitors.
Real-World Example: Amadeus remains the largest GDS provider by a margin, with 37% market share by processing 36% of airline bookings globally which come from travel agencies. (Source: Amadeus Wikipedia). They boast a 435-airline network, 87,000 hotel properties and attributed themselves comprehensive supplier coverage.
The Network Effect Cycle:
With the evolution of the systems toward automation, the difficulty in reproducing integrated functions is even more complex. Running on otherwise common functionality, each automated process touchpoints those systems and then becomes too costly to replicate.
Case Study: Navan’s Integration Strategy
The integration strategy of Navan (formerly TripActions) shows the complexity of integrations as it also includes an end-to-end automation platform. As the world’s first travel company to implement Generative AI across their stack and product features (Source: Navan Blog), they have built systems that fit together, where:
Business Results:
Automated systems boost performance at no extra cost by leveraging algorithms that learn optimal pricing, predict upsets, and personalize targeting all from the data they collect.
Tangible Performance Benefits: Based on research conducted by Automation Anywhere, businesses commonly realize a 250% ROI and pay back their investment in the solution within just six to nine months of deploying RPA. (Source: Exela Technologies)
But the sustainable competitive advantage comes in the years 2-5, when the aggregate learning leads to performance gaps that competitors will be unable to close through any marginal innovation, no matter how their ability to “out-innovate”
Automation advantages develop through predictable stages, with sustainable competitive advantage emerging after 18-24 months of operation.
| Timeline | Automation Development Stage | Competitive Advantage Strength | Key Characteristics |
|---|---|---|---|
| Months 1–6 | Implementation & Basic Functionality | Minimal | Cost savings, process efficiency, initial data collection |
| Months 6–12 | System Optimization & Learning | Low | Pattern recognition, workflow optimization, user adoption |
| Months 12–18 | Data Accumulation Critical Mass | Medium | Predictive capabilities, client intelligence, service differentiation |
| Months 18–24 | Network Effects Emergence | High | Platform value increases, supplier/client attraction accelerates |
| Year 2–3 | Integration Complexity Peak | Very High | Competitive moat established, replication costs exponential |
| Year 3+ | Self-Reinforcing Dominance | Sustainable | Permanent intelligence gaps, winner-take-all dynamics |
The 18-Month Data Threshold: Systems achieve critical mass for predictive analytics and smart decisioning post exposure to between 10,000-50,000 transactions, depending on business model and customer variance.”
The 24+ Month Integration Threshold: The level of interconnectedness in a platform results in the logistics around replication being about rebuilding entire technology stacks, not install individual pieces of tech.
The 36-Month Network Threshold: Market positioning is defensible by virtue of a combination of data scale, integration overhead, and network effects.
Automation is a key driver to realize competitive advantages on operational efficiency, delivering value to customers, and position on the market.
Intelligence Gap Measurement: Organizations with two or more years of automation data at their disposal achieve 40-60% greater accuracy when predicting client patterns, demand telemetry and price optimization over their manually controlled competitors.
Service Delivery Differentiation: Automation solutions decrease response time from 15-30 minutes (manual response) to below 5 minutes (automated response) for complex queries and with better accuracy.
Barriers to market entry: Reproduction costs for integrated automation platforms are 2-10 million dollars, based on business model complexity-which constitutes substantial barriers for new entrants to the market.
Amadeus shows how automation completes the competitive advantage loop via network effects and data aggregation. As the GDS with the most integrated suppliers, their position enables perpetuating cycles such as:
Factors of Sustainability:
Navan illustrates sustained differentiation in relation to complexity of integration and adaptive systems:
Technological Integration:
Outcomes on the Market:
Successfully building sustainable competitive advantage through automation requires strategic planning and systematic execution.
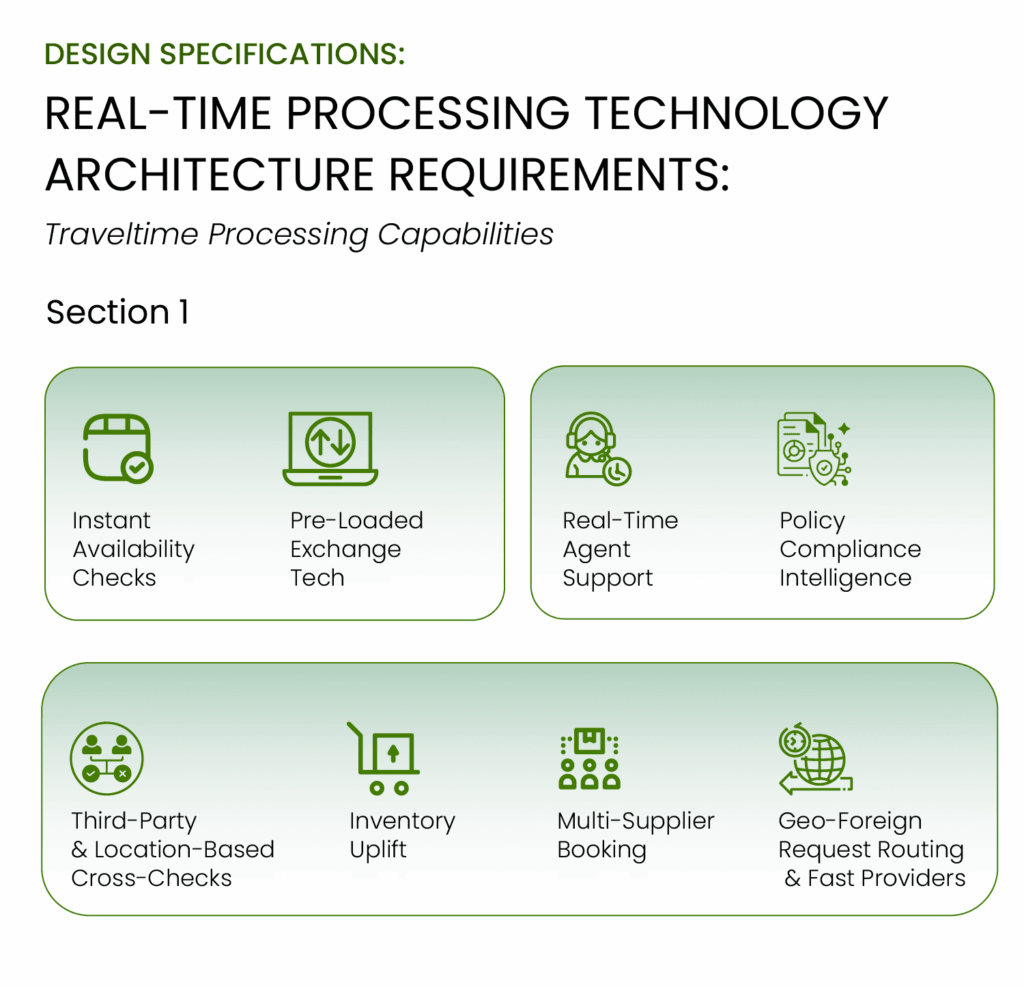
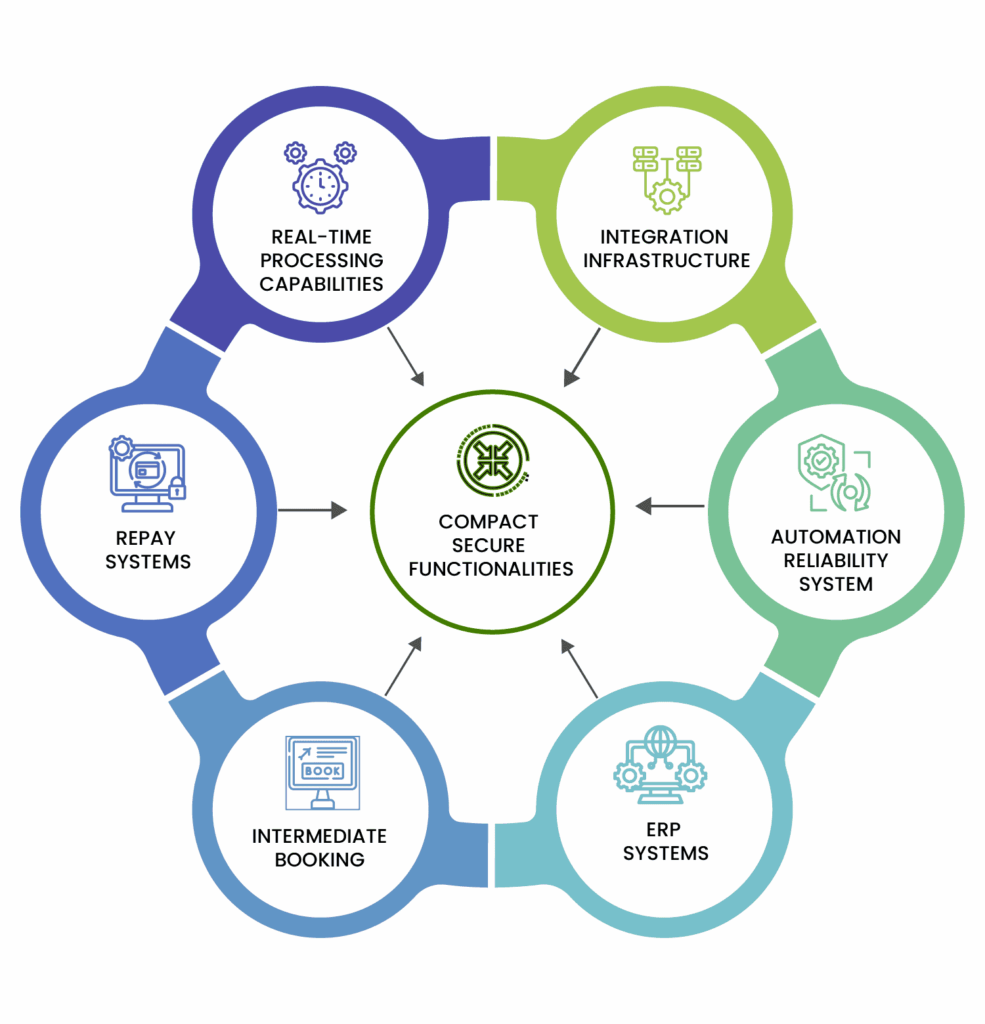
Real-Time Processing: Applications should be able to manage real-time availability checking, compliance policy checking and confirmations across multiple suppliers concurrently.
Integration capabilities: Integrate with the client’s ERP, HR and existing travel tools with no disruption to their existing workflow.
Design for Scalability: System designed to scale with customer(s) business and transaction volume, without loss of speed or increases in cost related to scale.
Executive Commitment: Sustainable automation advantages require C-level sponsorship and long-term investment commitment rather than project-based thinking.
Skills Development: Training programs that transition employees from manual processing roles to automation management and client relationship functions.
Change Management: Systematic approach to organizational transformation that maintains service quality during implementation phases.
Data Quality Management: Automatic system needs high-quality input data to generate right insights and predictions.
Privacy and Security: Firm wide governance over data to protect client data and allow intelligent automation.
Performance Tracking: Ongoing monitoring of how automation is working, and competitive advantage is being created.
In the B2B travel market, process automation shifts process optimizations as a B2B competitive advantage. Unlike traditional competition which faces shortening replication cycles, automation provides ever-compounding data advantages, network effects, integration complexity, and self-sustaining learning frameworks.
It has been proven that the increase, rather than erosion, of automation-based competitive advantages over time validates the primary determinant of sustainability. Companies adopting overarching automation frameworks don’t merely enhance operational productivity; they build competitive defensive structures that become increasingly, and exponentially, harder to imitate as time goes on.
The timeline for creating a sustainable automation advantage follows distinct phases, with a defensive market position emerging 18-24 months and sustainable control being reached within 3-5 years. This form of time dependency affords early adopters of automation advantages while pushing later adopters to deal with high costs.
The choice for B2B travel companies is strategic and two-fold: build sustainable automated competitive differentiators or resign themselves to a passive subordinate position to more automated market opportunists.
The window for establishing automation leadership remains open but is narrowing as early adopters accumulate data advantages and network effects that will become increasingly difficult to overcome.
This question directly addresses the core concept of the article. People will want to understand what process automation entails (e.g., automated booking, expense management, AI assistants) and how it's fundamentally different from traditional advantages that are easily copied. The answer should highlight the compounding benefits mentioned in the text (data accumulation, network effects, integration complexity, self-upgrading systems).
This addresses the problem statement of the article. Users will want to know why the industry has shifted and why old methods are failing. The answer should reference the points about NDC democratizing access, SaaS solutions making technology accessible, and self-service preferences diminishing the impact of human-centric premium service.
This is a practical question about implementation and ROI. The answer should refer to the "Automation Advantage Timeline" in the article, outlining the stages (initial implementation, optimization, data critical mass, network effects emergence, integration complexity peak, self-reinforcing dominance) and the key thresholds (18-month data, 24-month integration, 36-month network).
Potential adopters will be looking for concrete evidence of value. The answer should summarize the "Financial Impact Analysis" and "Performance Measures for Competitive Positioning" sections, including examples like expense savings, improved customer support efficiency, increased policy compliance, revenue growth, and intelligence gap measurements.
This addresses the "how-to" aspect. People considering automation will want to know the practical steps and potential pitfalls. The answer should cover the requirements for technology architecture (real-time processing, integration capabilities, scalability), organizational development (executive commitment, skills development, change management), and data strategy and governance (quality management, privacy/security, performance tracking).

Travel Automation Expert

